Mandelbrot Images

The images on this page were all generated from the Mandelbrot set using a program I wrote. The Mandelbrot Set is probably the most famous fractal. Mandelbrot images are generated using an iterative function applied to the coordinates of each pixel in the image. The color for each pixel is simply chosen according to the number of iterations the function required to finish. Points are either in the set or not as decided by the function. Points determined to be in the set are typically colored black.
For the first set of images below, I used a fairly generic implementation of a Mandelbrot generator except for an original contribution I developed which allocates colors to ranges of exit values in proportion to the amount of area they cover. It uses a histogram equalization technique to allocate more colors in larger regions at the expense of smaller regions where liberal allocation would be mostly wasted. This brings out the smooth and subtle gradations which other similar programs often loose. Best of all this allocation is done completely automatically working quite well even when there are enormous ranges in the magnitude and distribution of exit values.
The Mandelbrot Set is an excellent example of superliminosity since every colored pixel represents a point that proved to be outside the limits of the Mandelbrot Set, and the displayed color represents just how far from that limit it is.
This one is perhaps my favorite since I feel that it has a very good balance of complexity, smoothness and variation. Note that the choice of colors in the pallet is independent from the algorithm that maps them to ranges of exit values and that the pallet can easily be manipulated after the image is produced. The particular color map I used with all the images on this page is admittedly garish and any artist should have no problem improving on it. I choose it simply because it gave a wide variation in hue.
This one is particularly disturbing being somewhat reminiscent of a brain or embryo or other organic form.
This one is from a particularly deep zoom where the computer's floating point precision is beginning to run out with the loss of resolution resulting in rectangular blocks of pixels.
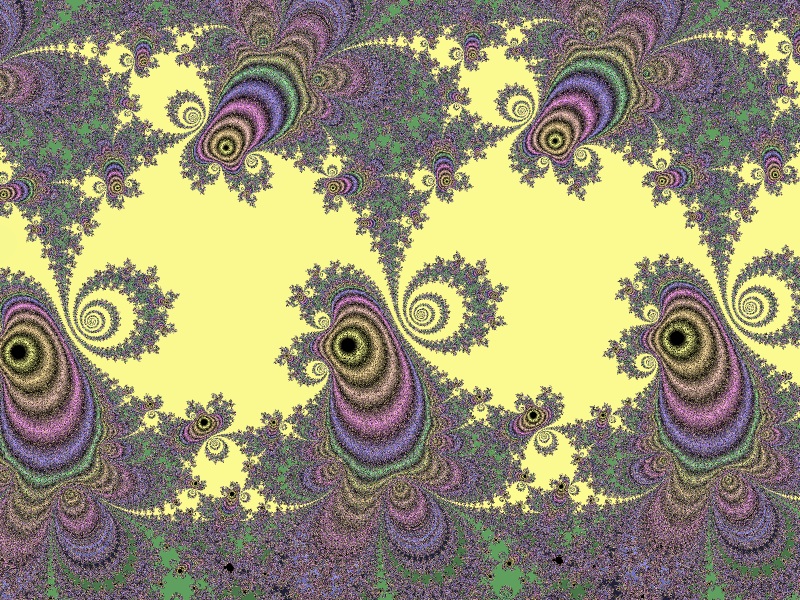
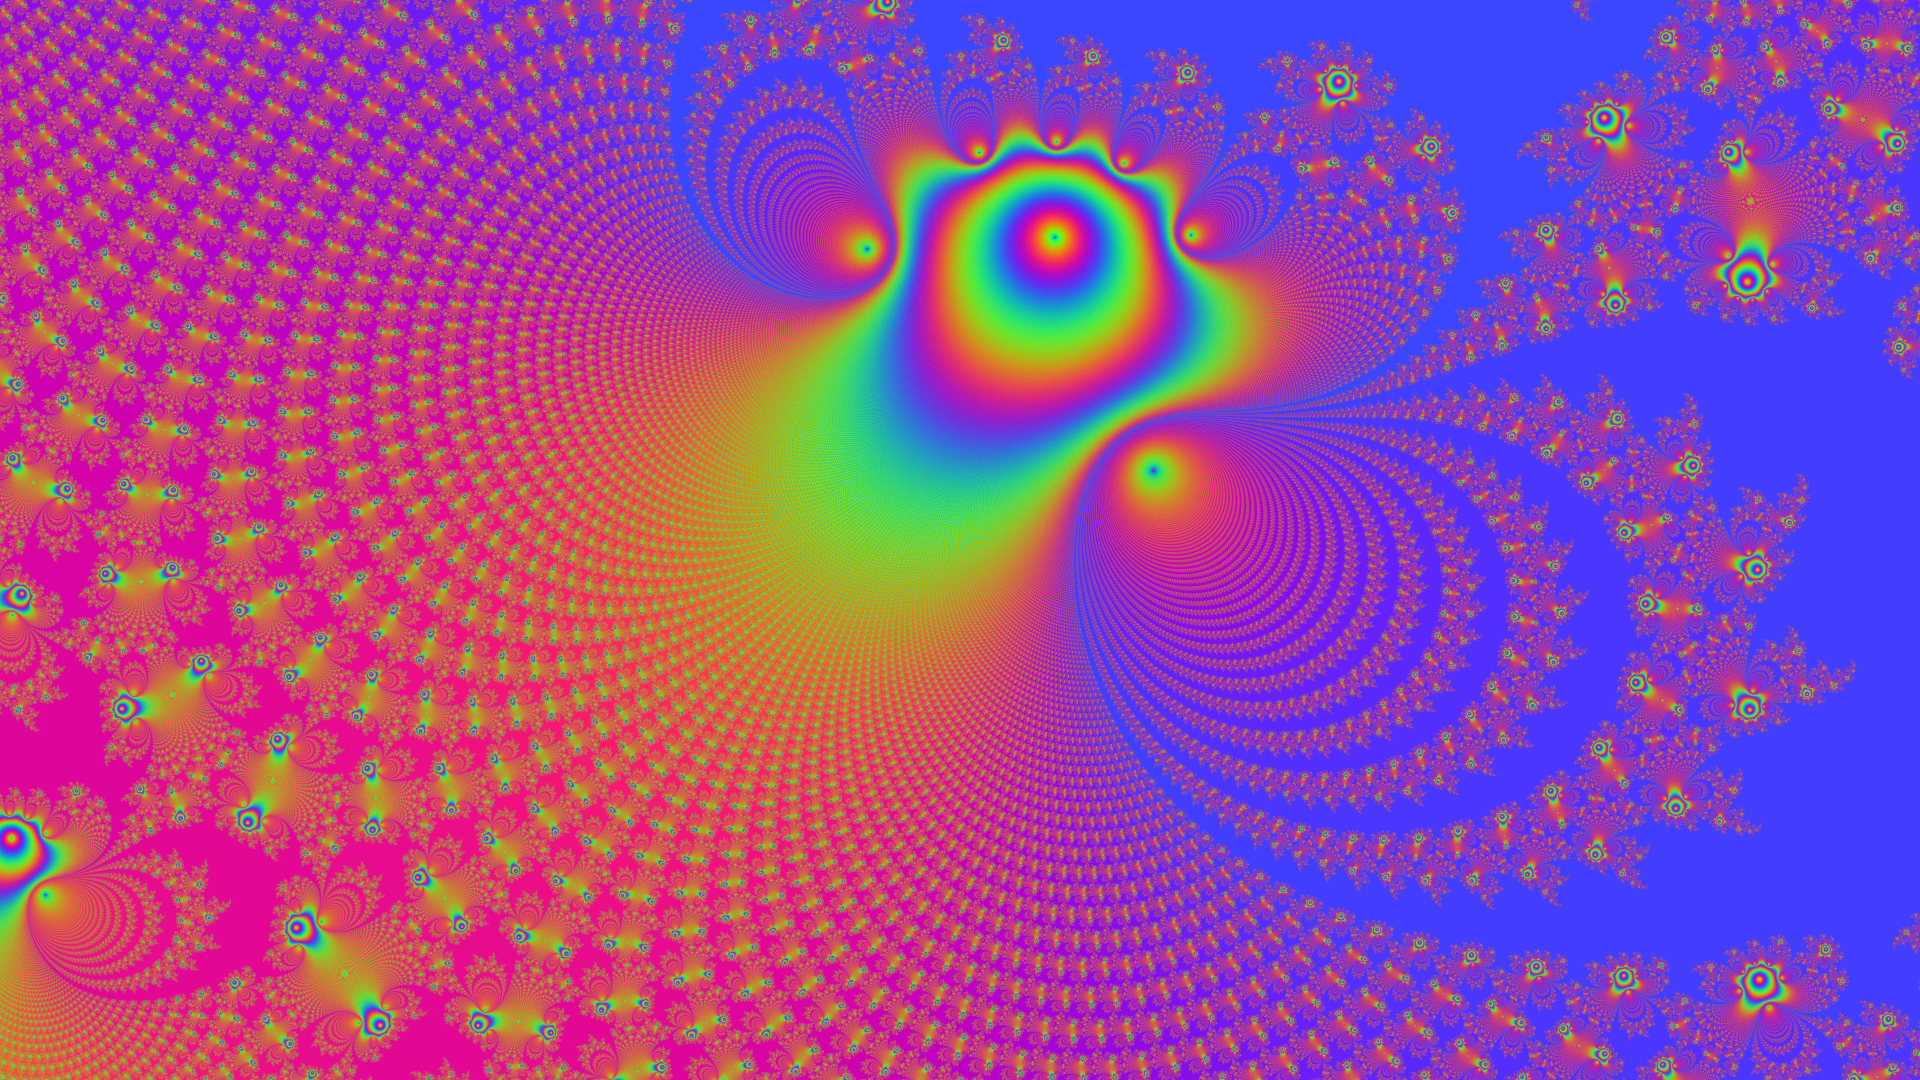
This is a fairly typical Mandelbrot image from the "Valley of Seahorses" region.

The coordinates for this image was taken from the book "Chaos".
Here's a region I call Bird Of Paridise. It is from a deep zoom, but more importantly, it's deep in a region that is extremely expensive to render, which was my goal. This particular image required over one trillion iterations of the Mandelbrot function to complete. It also contains a very extreme range of exit values which demonstrates the value of my color selection algorithm. Try calculating it yourself using just about any other fractal image generator and you'll likely only get a chaotic mess. Here is the image data for the Bird of Paridise region:
| Center X Coordinate | 0.3750001200618655 |
| Center Y Coordinate | -0.2166393884377127 |
| Size | 0.000000000002 |
| Max Iterations Per Pixel | 1000000000 |
You can see another rendering of this region by Walter Brameld IV kindly generated a really high resolution version that I could have printed on canvas my mother's birthday. Here is a medium resolution version of the resulting image. Another person who goes only by the name The Almighty Pegasus Epsilon created this lovely render of the region.
In a moment of perversity, I tried to find a region of the m-set that would be as expensive to render as possible and still look interesting. It's really difficult to find a decent region that is very slow to render. Eventually I came up with the following parameters which turned out to be amazingly difficult to render. It turned out to be so hard that even at 800x600 resolution I never rendered more than a few lines. Walter took up this challenge and invested over one CPU year of of computation on his rendering farm to complete the task. Here is the mystery image I waited over a decade to see:
Thanks Walter!
Here is the image data for this image in case you want to try it yourself:
| Center X Coordinate | -0.13856524454488
|
| Center Y Coordinate | -0.64935990748190 |
| Size | .00000000045
|
| Max Iterations Per Pixel | 5000000000 |
To see my contributions to fractal methods can be found
here.
A beautiful freeware real-time Mandelbrot zoomer can be found at
XoaS Software.
You may also enjoy viewing
Dan Freeman's fractal gallery that he too created with his own custom software.
Here is a lovely
Mandelbrot atlas at miquel.com to help guide you on your own explorations of this strange world. Be safe, have fun, take pictures, and mabe send me a postcard if you feel like it.